Turn Project Data
into Decisions
Analyze progress, cost, performance, and resource data on a single platform to monitor project status in real time and make more informed decisions.

Analyze progress, cost, performance, and resource data on a single platform to monitor project status in real time and make more informed decisions.
Bring project data from different modules together in a unified analytics framework to make progress, costs, performance, and risks measurable.

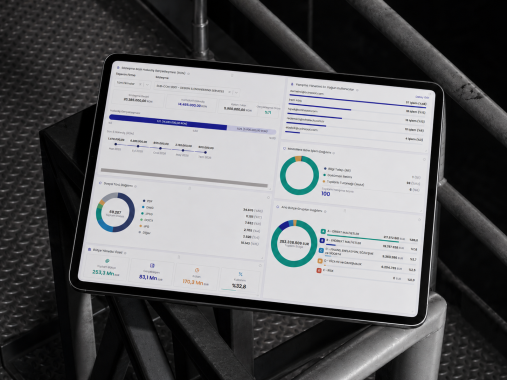
Track progress, cost, budget, workforce, equipment, quality, and risk indicators through dashboards designed for project managers and senior management.

Compare planned and actual progress; analyze delays, variances, productivity, and key performance indicators.

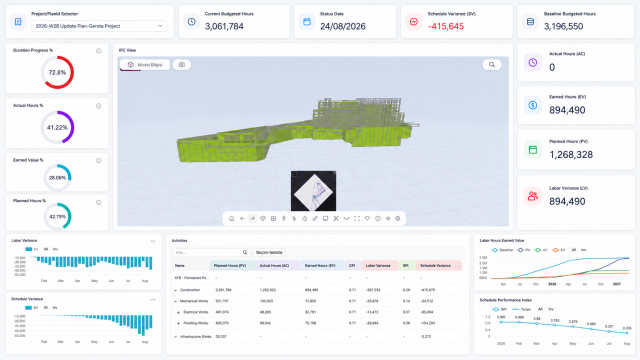
Evaluate project cost and schedule performance by tracking planned value, earned value, and actual cost data.

Create dynamic reports based on criteria such as project, date, company, contract, discipline, location, and status, and share them in multiple formats.
Rather than presenting the entire platform as a single workflow, explore how each module works through its own defined steps.
Track progress, cost, budget, workforce, equipment, quality, and risk indicators through dashboards designed for project managers and senior management.
Define the progress, cost, resource, quality, HSE, and risk indicators to be monitored throughout the project.
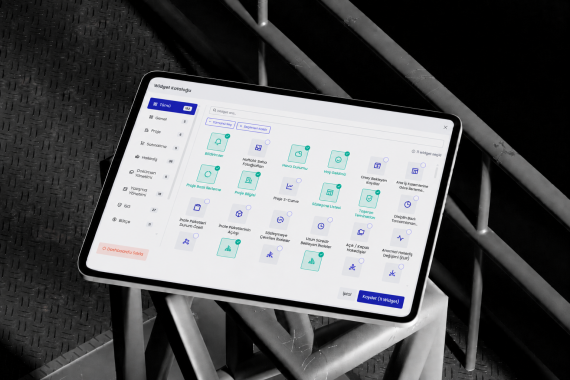
Consolidate up-to-date data from different modules into a unified dashboard structure.
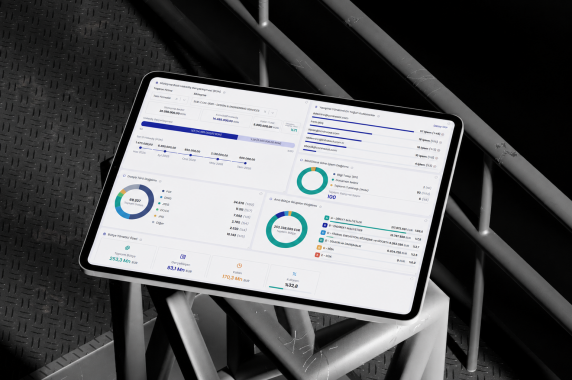
Create tailored dashboards for different user groups, such as project managers, department managers, and senior management.
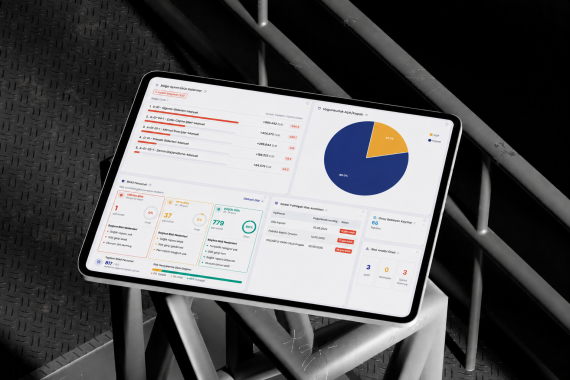
Highlight delays, budget overruns, open risks, non-conformities, and pending approvals with color-coded alerts.
Compare planned and actual progress; analyze delays, variances, productivity, and key performance indicators.
Import schedule activities, target quantities, and planned start and finish dates into the system.
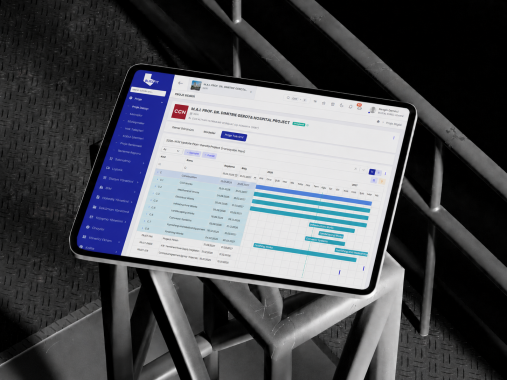
Consolidate actual progress data from site works, daily reports, progress payments, and progress records in a single location; compare it against planned values by period, activity, discipline, and location.
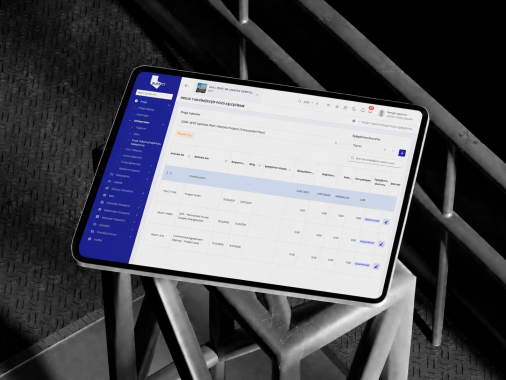
Identify activities that are ahead of or behind schedule, and evaluate completion rates, delays, productivity, and team performance.
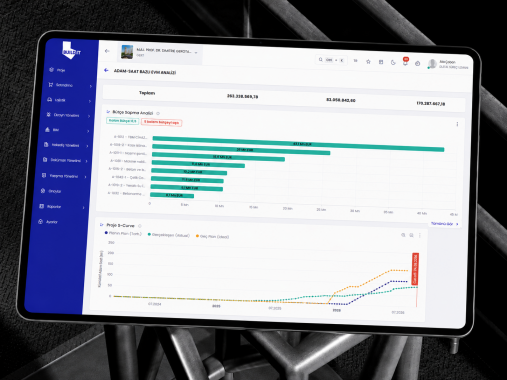
Manage corrective actions for critical variances by assigning responsible parties, adding descriptions, and setting target dates.
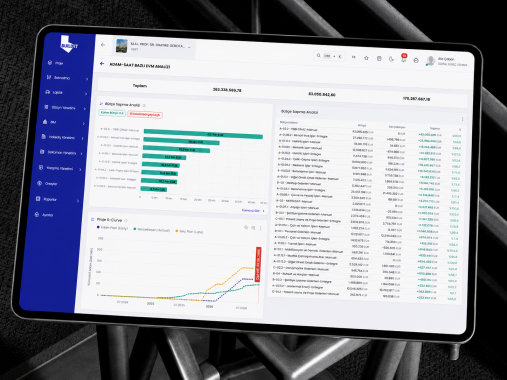
Evaluate project cost and schedule performance by tracking planned value, earned value, and actual cost data.
Select the project, reporting date, and analysis period for cost and earned value analysis.
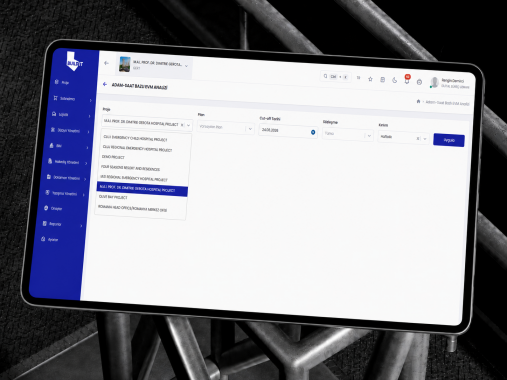
Calculate Planned Value, Earned Value, and Actual Cost using schedule data, progress rates, and cost records.
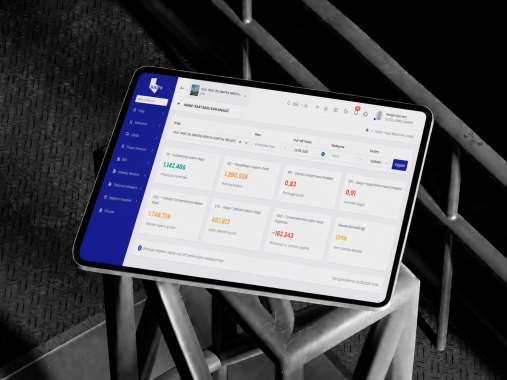
Evaluate the project’s current performance using the Cost Performance Index and Schedule Performance Index.
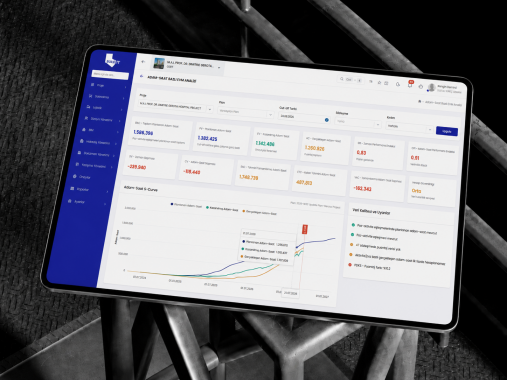
Analyze the estimated cost at completion, remaining cost, and projected completion status based on current performance.
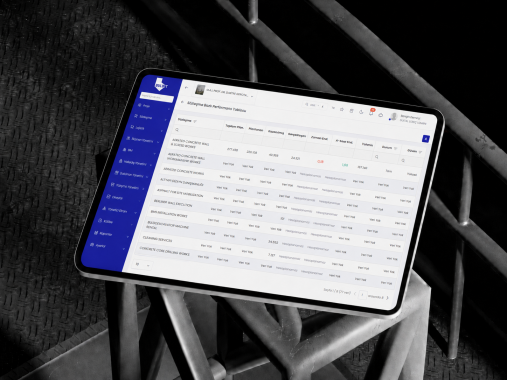
Create dynamic reports based on criteria such as project, date, company, contract, discipline, location, and status, and share them in multiple formats.
Define the scope of the report using progress, cost, personnel, equipment, quality, HSE, contract, or other project data.
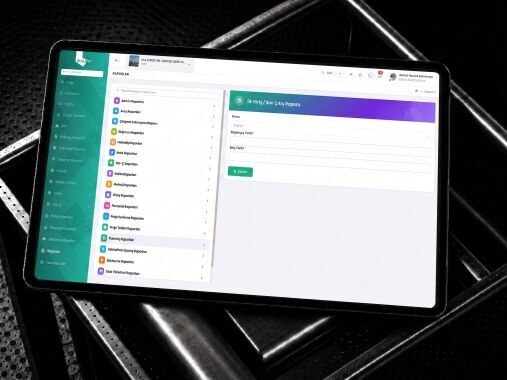
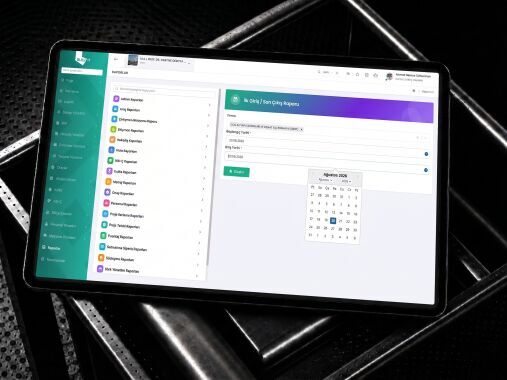
Select report filters such as project, date, company, contract, location, discipline, and status.
Save the report template in the system for personal or organizational use.
Generate the report in Excel, PDF, or on-screen format and share it with the relevant project stakeholders.
Integrate your design processes with BUILD IT’s other solution areas and manage project data seamlessly from design through to site execution.